

Get Your Data In
Load your first four tables into Keboola Storage with the HTTP data source connector, pulling the sample CSV files straight from a URL.
A sighting row in this dataset carries an aphia_id, not an octopus’s name — and the sightings,
the species register, the depth zones and the ocean basins arrive as four separate files. Apart,
the sightings file can plot 10,000 dots, but it cannot say which octopus any dot is or which
ocean it sits in. This step gets all four into Storage so the next step can join them into one
table.
Step 2 of the Getting Started arc.
Two ways to do it — pick a tab in Set it up below. Kai does the whole job in one prompt, run included; the clicking is still written out in full, and it is worth seeing once where a configuration and its rows live — later steps refer back to that.
What you need
Section titled “What you need”A Keboola project you can sign in to. If you do not have one, start with Get a Project.
Nothing to download — the connector fetches the files itself.
The sample data
Section titled “The sample data”Four tables: 10,000 recorded octopus sightings (1900–2026, with coordinates and — for almost
half — a depth), the register of the 201 species they belong to, the five ocean depth zones,
and the ocean basins as coordinate ranges. Each table is only half the story — a sighting names
its species by aphia_id, not by name, and nothing in it says “Twilight zone” or
“North Atlantic”. They are published here, and the connector reads them over HTTPS:
| Table | File |
|---|---|
| sightings | /getting-started/occurrences.csv |
| species register | /getting-started/species.csv |
| depth zones | /getting-started/depth_zones.csv |
| ocean basins | /getting-started/basins.csv |
Every octopus in this data is real: the sightings are a fixed sample of the Ocean Biodiversity Information System (OBIS) records for the order Octopoda, with species names from the World Register of Marine Species. The basins table is a deliberately rough coordinate-box approximation — good enough to answer “which ocean”, and honest about being a teaching table.
How loading works
Section titled “How loading works”Data gets into Keboola through data source connectors — components that fetch from a source on demand or on a schedule. There are hundreds of them: databases, APIs, ad platforms, cloud drives. They differ in how they authenticate and what they can fetch, but they all end the same way: rows in a Storage table.
You will use the HTTP connector, which downloads CSV files from a URL. It is the simplest one that still behaves like a real connector — it can be re-run, scheduled, and dropped into a flow, which is what step 5 depends on.
One configuration can fetch many files, so you will build a single configuration holding four tables rather than four separate configurations.
Set it up
Section titled “Set it up”Setting up a data source connector is one of the things Kai does (Integration Setup). Open Kai Agent in the top bar and ask for the whole configuration at once:
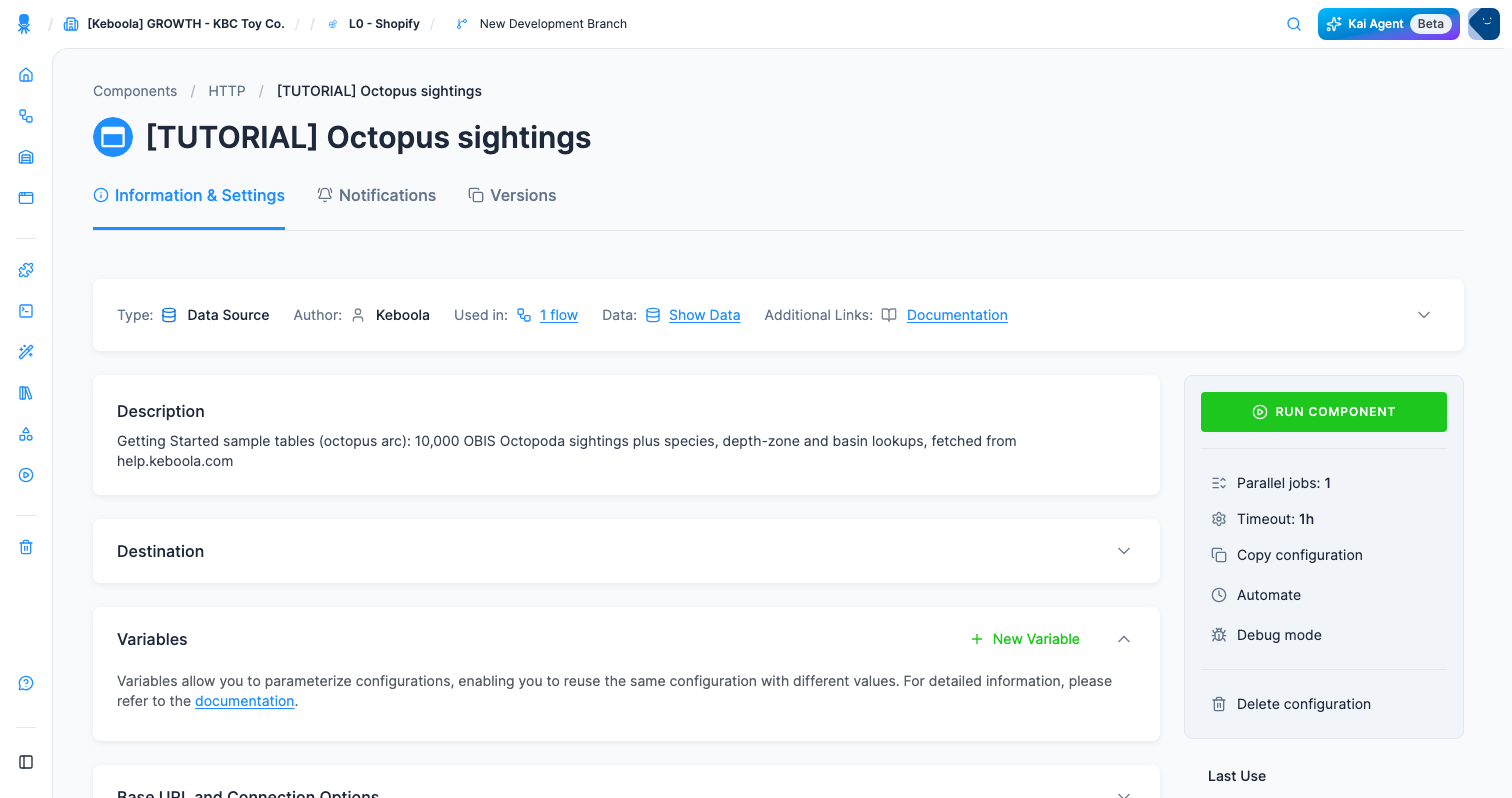
Create one HTTP data source configuration called "[TUTORIAL] Octopus sightings", with base URLhttps://help.keboola.com and four rows — one per file — fetching /getting-started/occurrences.csv,/getting-started/species.csv, /getting-started/depth_zones.csv and /getting-started/basins.csvinto the tables occurrences, species, depth_zones and basins. Then run it and tell me the rowcounts.One configuration with four rows, not four configurations: step 5 runs this as a single task and the parallelism note below assumes that shape.
Check: four tables in Storage with 10,000 / 201 / 5 / 13 rows, and a Rows list showing four entries, as in Check it worked. If Kai built something else, delete it and switch to the Do it yourself tab — the ten minutes are worth it anyway, since the rest of the arc assumes you have seen where a configuration and its rows live.
Create the configuration
-
Open Components and search for
HTTP. Pick the plain HTTP (Data Source) — the one described as Downloading CSV files from any HTTP, and HTTPS URL — and click Add Component (the card says Create Configuration instead once the component already has configurations in the project). The other match, HTTP Advanced (Beta), is a different component. Newer connectors with HTTP in the name may also appear; go by that description rather than by position in the list.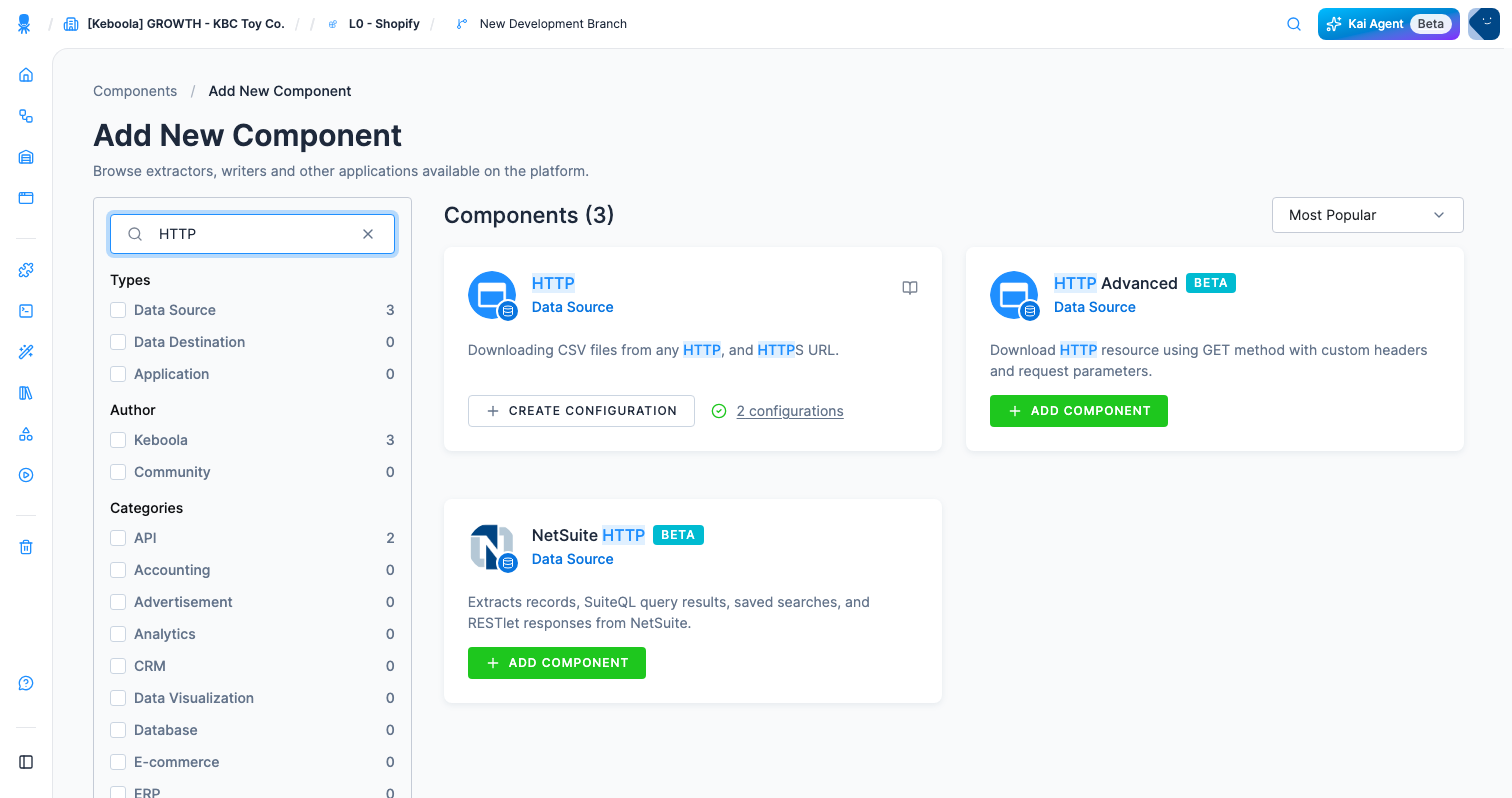
-
Choose Connect To My Data. (Use With Demo Data sets the connector up against a dataset Keboola prepared — handy for a look around, but here you want your own URL.)
-
Replace the suggested name with
[TUTORIAL] Octopus sightings, add a description, and click Create Configuration. Descriptions are what keep a project readable six months later; see the best practices cheat sheet.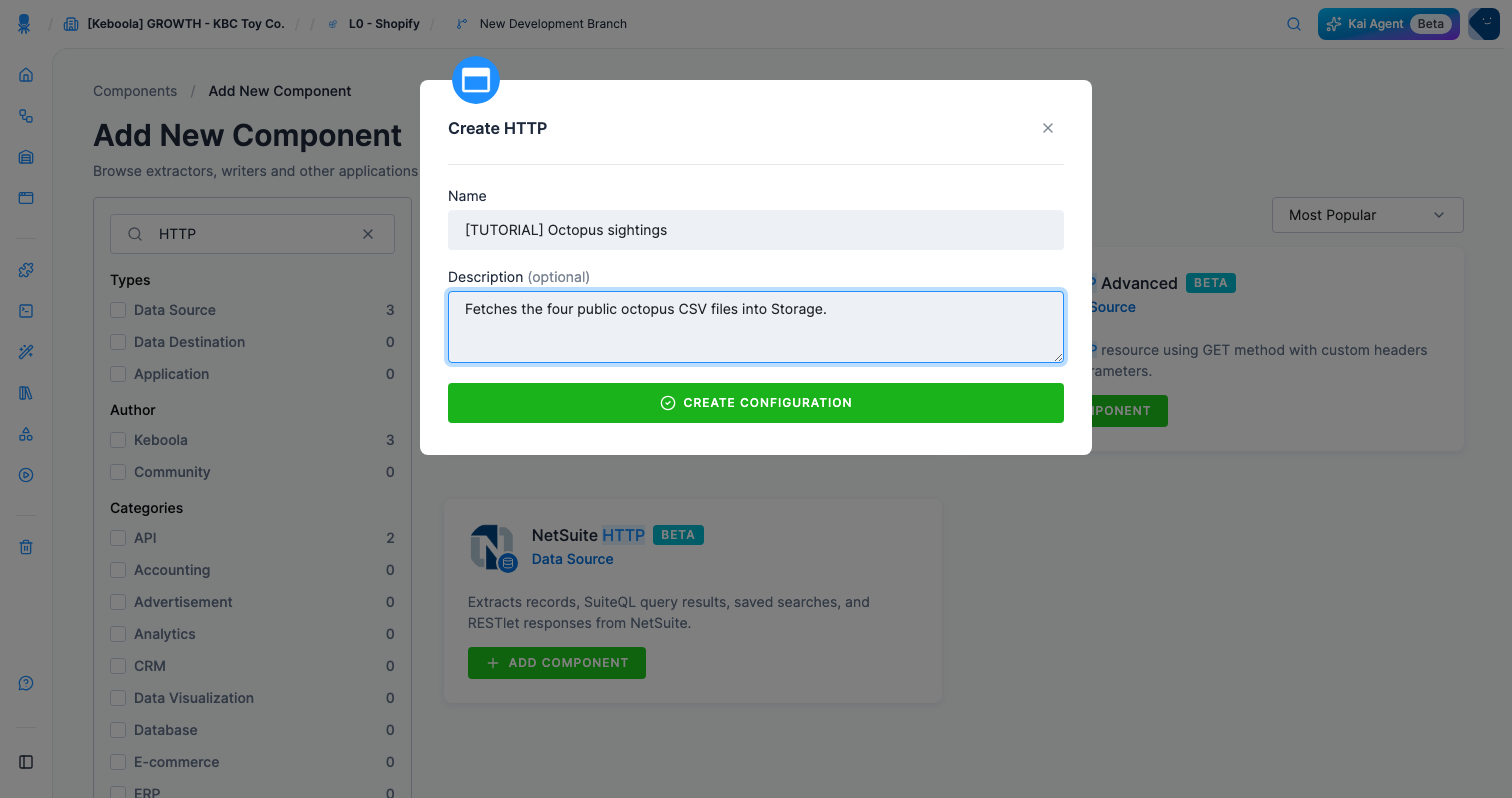
-
If the configuration opens with a single File URL field, switch to Advanced Mode. A new configuration may start in a simplified mode that takes one URL and nothing else — no base URL, no rows. Its own hint says as much: switch modes if you “want to load more files at once”. Use Advanced Mode, top right, and confirm. Note this is one-way: the button disappears afterwards, and the change is recorded on the configuration as Disable simplified mode. If you already see Base URL and Connection Options and a Rows section, you are in the right mode and there is nothing to switch.
-
Open Base URL and Connection Options and set Base URL to the prefix shared by every file this configuration downloads, then click Save:
https://help.keboola.com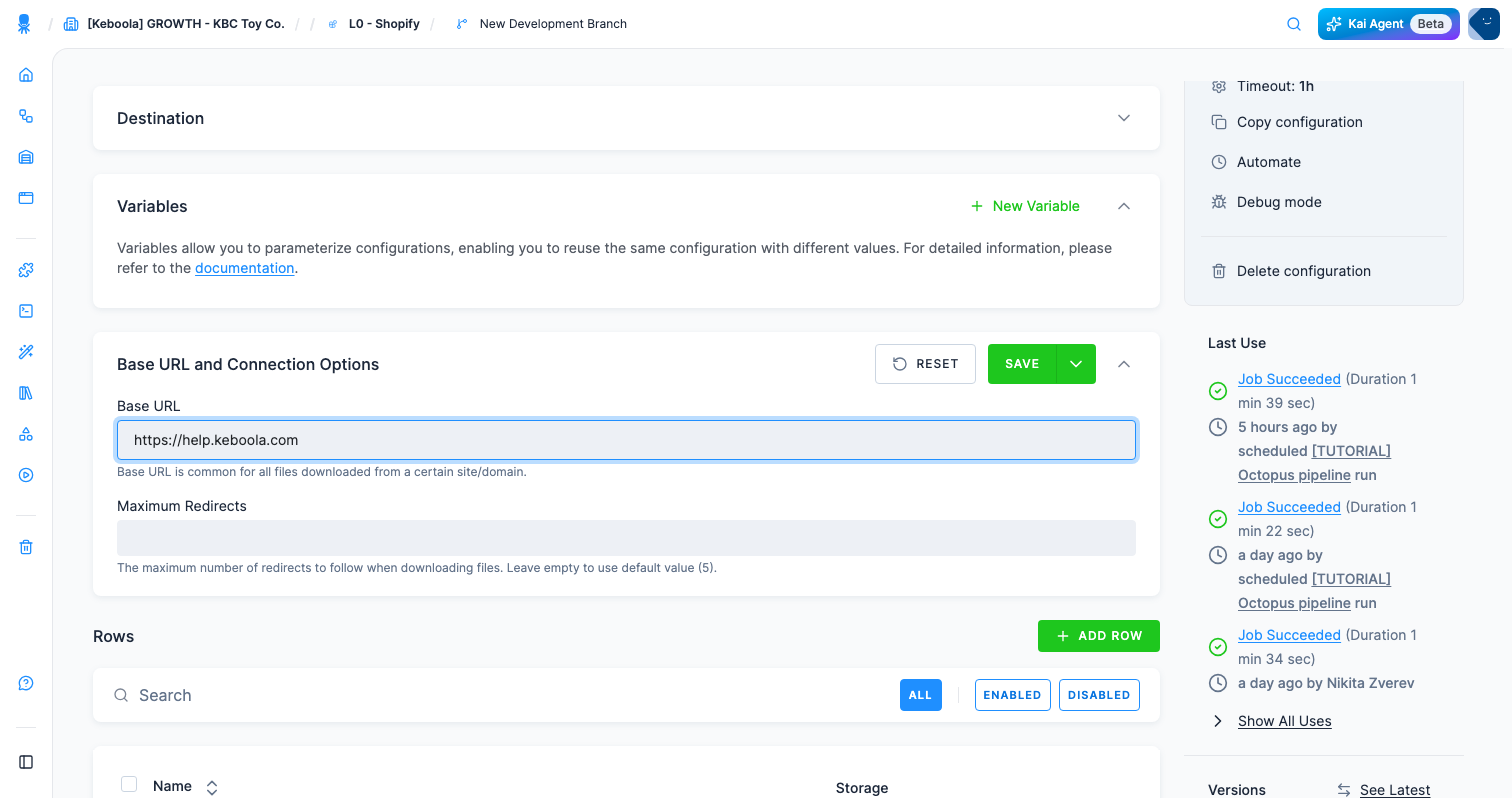
Add the four tables
Each file is a configuration row — its own path and settings, sharing the configuration’s base URL.
-
In the Rows section, click Add Row, name it
occurrences, and click Create. The row name becomes the Storage table name, so use exactly this spelling. -
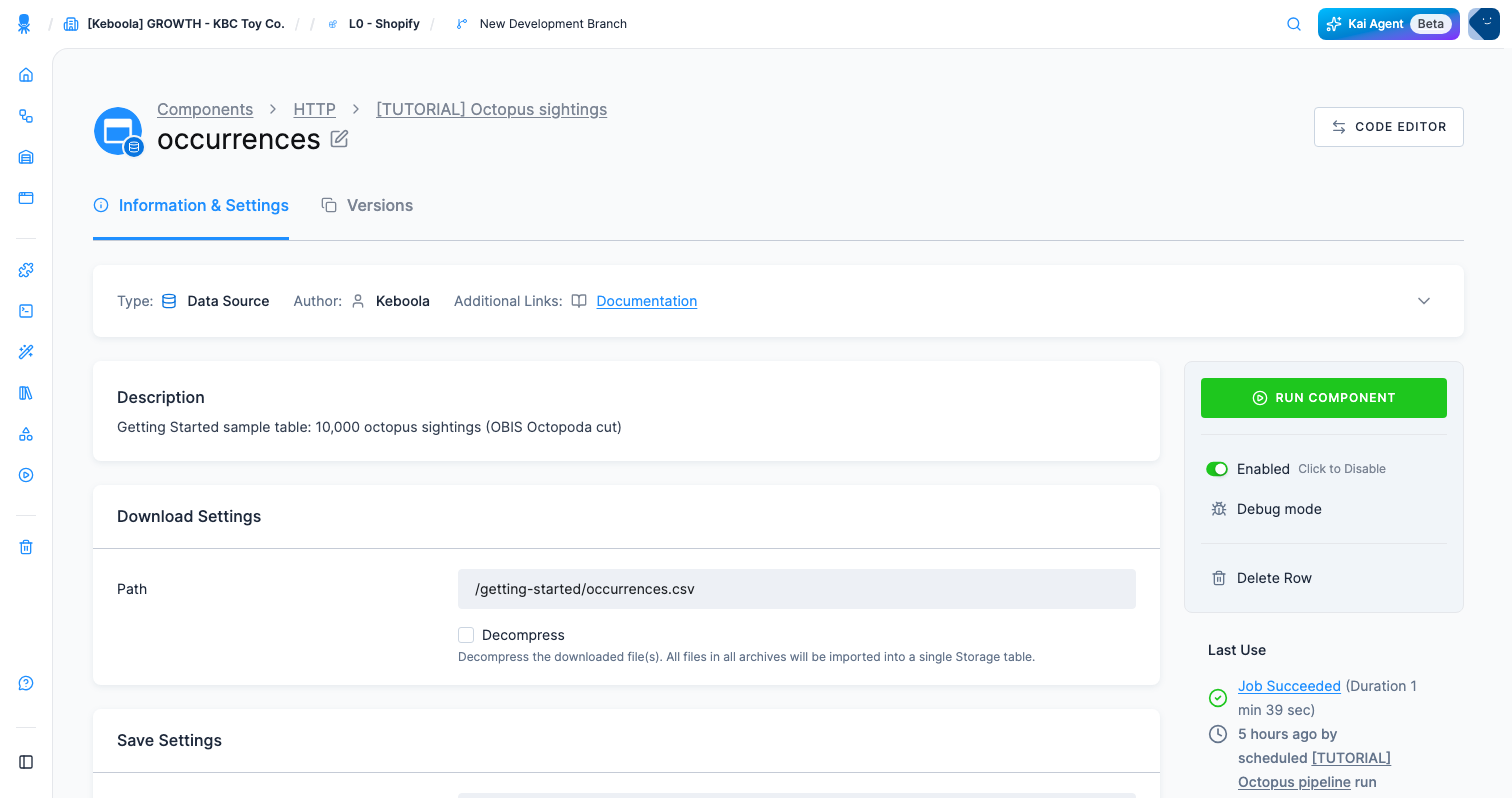
Under Download Settings, set Path to the file, relative to the base URL:
/getting-started/occurrences.csv -
Check the rest of the row and click Save:
- Save Settings → Table name is already
occurrences, taken from the row name. - Delimiter
,and Enclosure"are already right for these files. - Leave Incremental load off: each run should replace the table, not append to it.
- Header & Primary Key → Read Header already reads Read the header from the file(s)
header, which is what you want — the sample files carry column names on the first line.
Leave it alone. (The alternatives are typing the columns yourself or having them generated
as
col_1,col_2, ….)
- Save Settings → Table name is already
-
Repeat steps 6–8 for the other three files:
Row name Path species/getting-started/species.csvdepth_zones/getting-started/depth_zones.csvbasins/getting-started/basins.csv -
Back on the configuration, click Run Component and confirm with Run. One job fetches all four rows.
Check it worked
Section titled “Check it worked”Watch it in Jobs. The rows are fetched one after another, so expect a couple of minutes for all four.
Then open Storage. Data lives in buckets, and each bucket holds tables. The connector
created a bucket of its own — its name is the component plus the configuration’s ID, like
keboola-ex-http-01kz5050bhhezq9scmd0t9c73f, shown with an IN badge — holding four tables:
occurrences, species, depth_zones and basins.
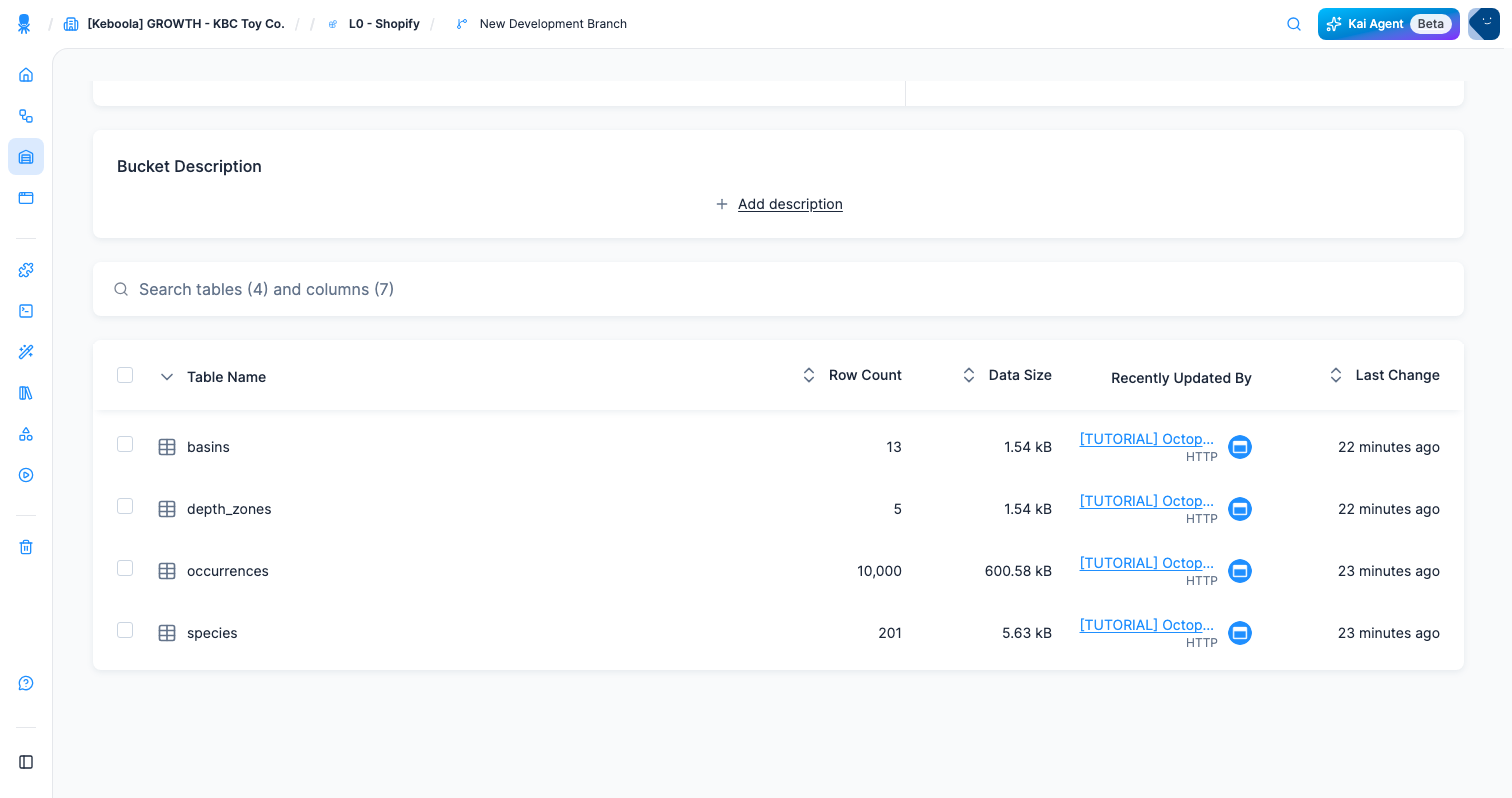
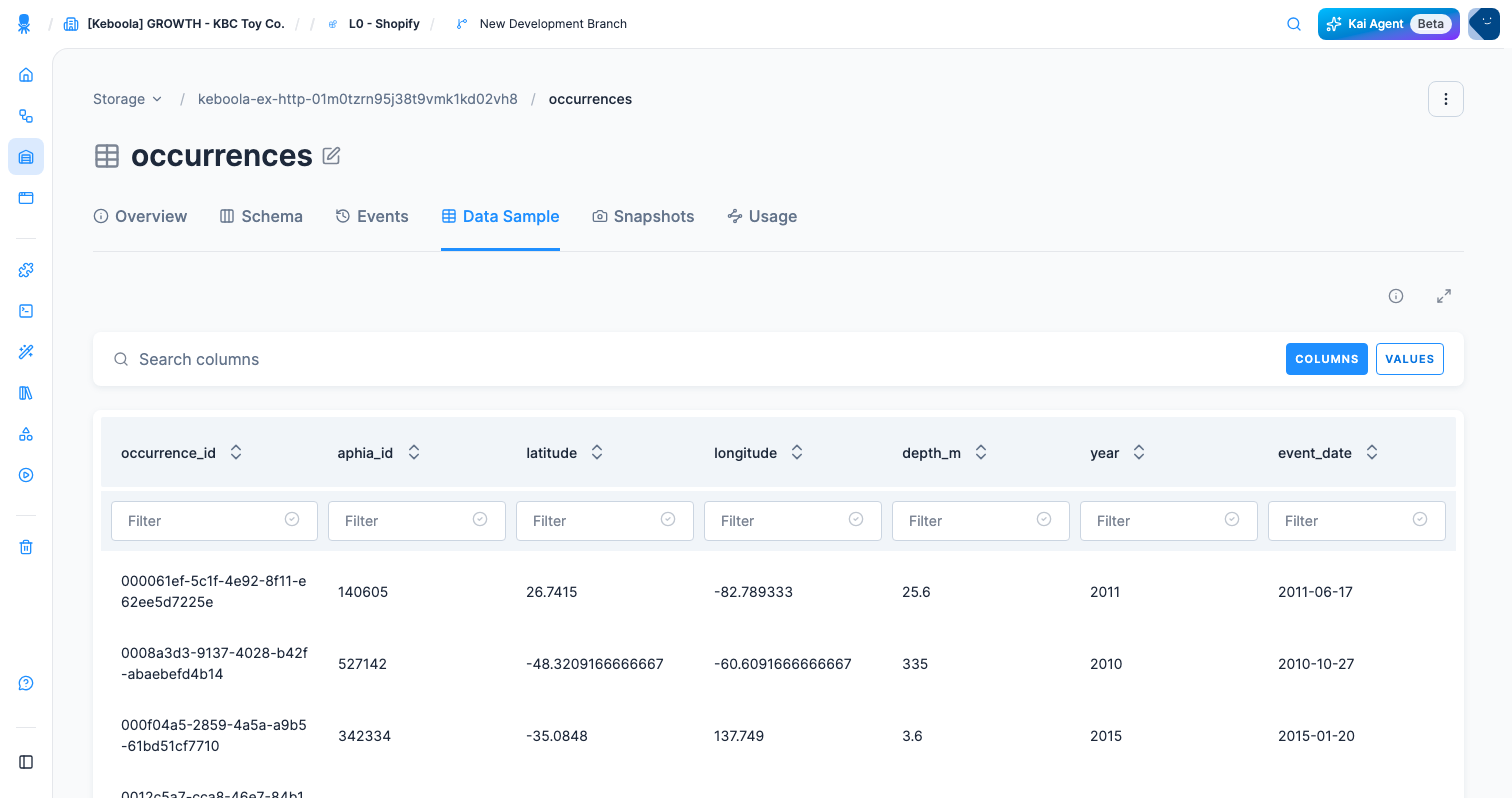
Click a table and open its Data Sample tab to see the real contents. occurrences should
have 10,000 rows with columns like aphia_id, latitude and depth_m; species 201 rows;
depth_zones 5; basins 13. If that matches, this step is done.
If it goes wrong
Section titled “If it goes wrong”- The job fails with a 404. The path is wrong, or missing its leading slash. Base URL and
path are concatenated, so
https://help.keboola.com+/getting-started/occurrences.csvis right, while a base URL with a trailing slash gives you a double slash. Open the full URL in a browser to see whether the file is really there. - Every row arrives as one column. The Delimiter setting does not match the file. These files are comma-separated.
- The first data row is missing, or columns are called
col_1. Wrong header option — set Read Header back to Read the header from the file(s) header. - The table is empty but the job succeeded. The URL returned an HTML error page instead of a CSV. Open it in a browser to see what actually comes back.
- You want the four files fetched at the same time. Raise Parallel jobs on the configuration — the connector then processes its rows concurrently.
- You would rather have Kai read the job. It has the log and the tables in front of it:
Read the last HTTP connector job and tell me what failed, then show me a sample of occurrences.
Going further
Section titled “Going further”Which way you load depends on how far along the project is. A public URL is the quickest way to get real data into a project you just created, which is why a proof of concept usually starts there. Production data rarely sits on one — it is behind credentials, in a database or a SaaS account, and it keeps changing, so the run you kicked off by hand becomes one that repeats on a schedule. Both side trips are this same step against a source you have to authorize first.
- Load from Google Sheets — a small reference table pulled from a spreadsheet you own, with an authorized account instead of a public URL.
- Load from a database — the pattern every database connector follows.
Next: Transform your data →